State Alcohol Consumption: Trends, Impact, and Insights
When talking about state alcohol consumption, the total amount of pure alcohol that residents of a specific state drink over a set period, usually expressed as gallons or liters per capita. Also known as regional drinking habits, it provides a snapshot of how much booze flows through a state's bars, bottles, and homes. State alcohol consumption encompasses per capita alcohol intake, shapes public health outcomes, and drives policy decisions.
Why Tracking State Alcohol Consumption Matters
One key metric behind the broader picture is per capita alcohol intake, the average amount of alcohol each adult consumes, usually measured in standard drinks per year. This figure lets researchers compare states on a level playing field, spot outliers, and identify trends over time. When per capita intake spikes, it often signals shifting cultural norms or the launch of new beverage categories, such as the recent surge in hard seltzers.
Another crucial piece of the puzzle is public health impact, the range of health outcomes—like liver disease, injuries, or reduced life expectancy—directly linked to how much alcohol a population drinks. Public health impact is influenced by drinking patterns and can dictate where resources for prevention and treatment are needed most. Studies show that states with higher per capita intake tend to have higher rates of alcohol‑related hospital admissions.
Legal frameworks play a silent but powerful role. alcohol regulations, the set of laws governing sales, marketing, age limits, and taxation of alcoholic beverages within a state shape how, when, and where people can drink. Regulations determine the legal drinking age, dictate where alcohol can be sold, and even set taxes that affect price. In turn, these rules influence state alcohol consumption by either curbing excess or, inadvertently, encouraging new consumption channels.
Finally, drinking patterns, the typical ways people consume alcohol—such as weekly binge sessions, daily moderate sipping, or occasional celebratory toasts, provide context to the raw numbers. Understanding patterns helps explain why a state with modest per capita intake might still face high rates of alcohol‑related accidents if binge drinking is prevalent. Together, these entities—per capita intake, public health impact, regulations, and drinking patterns—create a comprehensive view of state alcohol consumption.
Below you’ll find a hand‑picked collection of articles that dig deeper into health comparisons, tasting tips, and the latest trends shaping drinks across the country. Use them to broaden your knowledge, refine your palate, and see how the numbers translate into real‑world experiences.
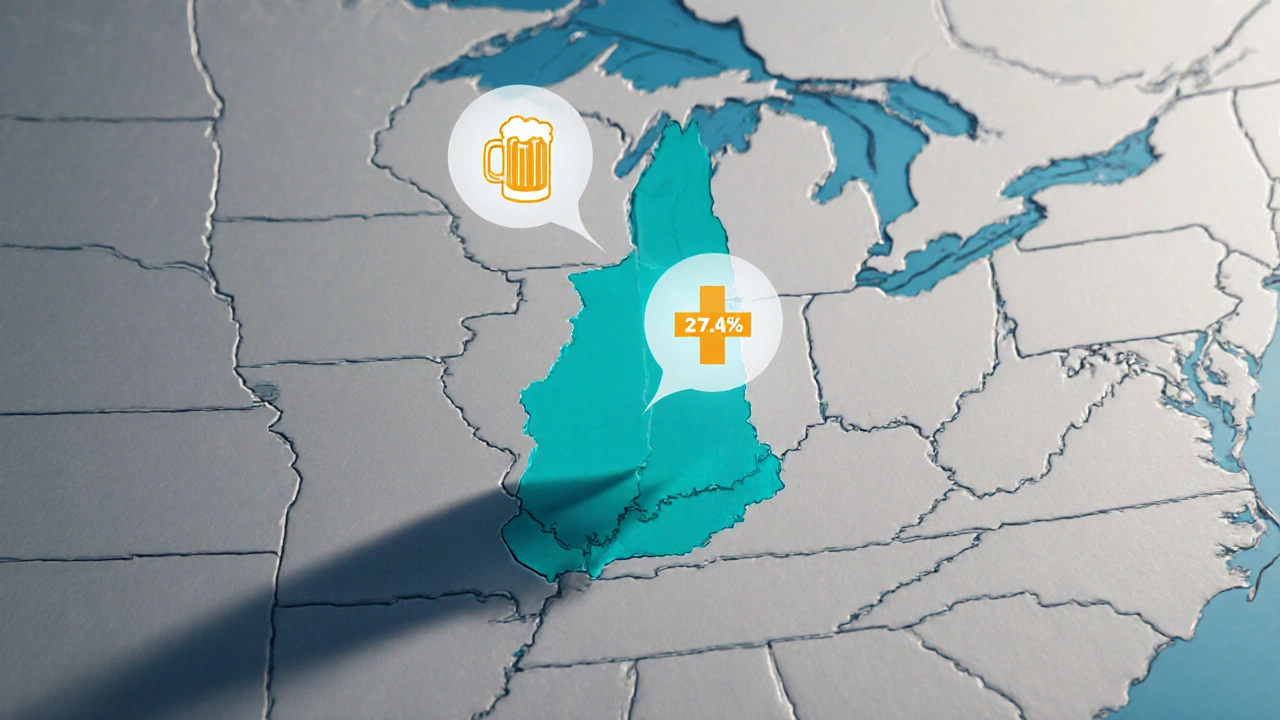
New Hampshire tops the U.S. for alcoholism, driven by culture, taxes, and festivals. Learn why, see the state rankings, and discover practical steps to curb alcohol abuse.
View Details