US State Alcoholism
When talking about US state alcoholism, the pattern of alcohol misuse across individual American states. It’s often measured by alcoholism rates, the percentage of adults who meet clinical criteria for alcohol use disorder and by binge drinking, consuming five or more drinks in a short period for men, four for women. These numbers help researchers spot hotspots and guide interventions. In short, the data tells us where the problem bites hardest and what we need to fix.
One big player in this picture is public health, the field that studies how health issues affect communities and designs ways to improve outcomes. High alcoholism rates raise hospital visits, increase accidents, and even boost chronic diseases like liver cirrhosis. By linking state‑level alcohol data to health statistics, public health officials can pinpoint which regions need more resources, whether it’s counseling centers or awareness campaigns.
What’s Driving the Numbers?
State alcohol policy plays a crucial role. Laws about minimum drinking age, taxation, outlet density, and DUI penalties all shape drinking habits. For example, states with higher excise taxes often see lower binge‑drinking frequencies. Meanwhile, looser licensing rules can make it easier for people to buy and consume alcohol, pushing the numbers up. Understanding these policy levers helps policymakers craft smarter rules that actually lower abuse.
Beyond laws, socioeconomic factors matter too. Income gaps, education levels, and employment status correlate with drinking patterns. In areas with limited job opportunities, some turn to alcohol as a coping mechanism, which spikes both alcoholism rates and binge episodes. Seeing these links lets community leaders address root causes, not just symptoms.
Trends over time reveal a shifting landscape. Over the past decade, some states have managed to cut binge‑drinking rates thanks to targeted campaigns, while others have seen rises tied to new marketing of low‑calorie mixed drinks. Tracking year‑by‑year changes gives a clear picture of what works and what backfires, guiding future public health strategies.
For anyone looking to get a handle on the issue, there are plenty of resources. State health departments publish annual reports, and the CDC offers a searchable database of alcohol‑related statistics. Prevention programs—like school‑based education and community support groups—show real impact when they’re aligned with local data.
Below you’ll find a curated set of articles that break down each of these angles in plain language. From the healthiest drink choices to how binge‑drinking affects your palate, the collection gives practical tips and deeper insights into the whole US state alcoholism puzzle. Dive in and see how the numbers translate into real‑world advice.
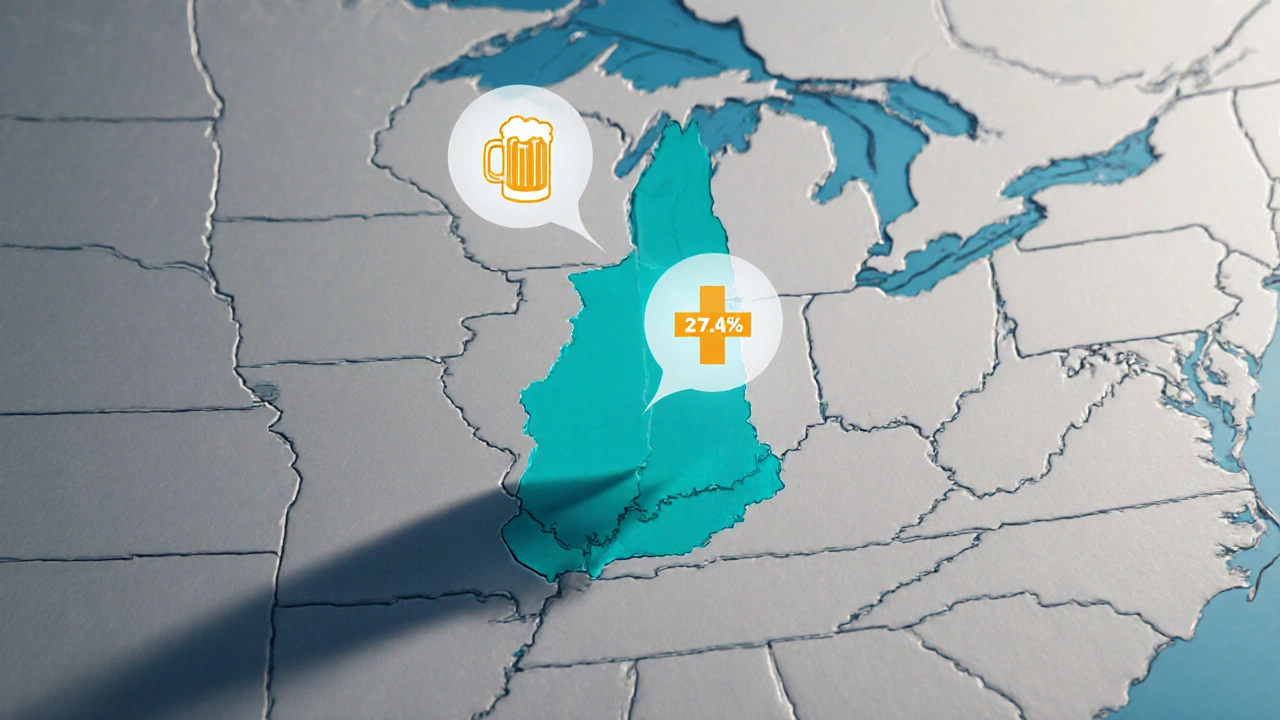
New Hampshire tops the U.S. for alcoholism, driven by culture, taxes, and festivals. Learn why, see the state rankings, and discover practical steps to curb alcohol abuse.
View Details